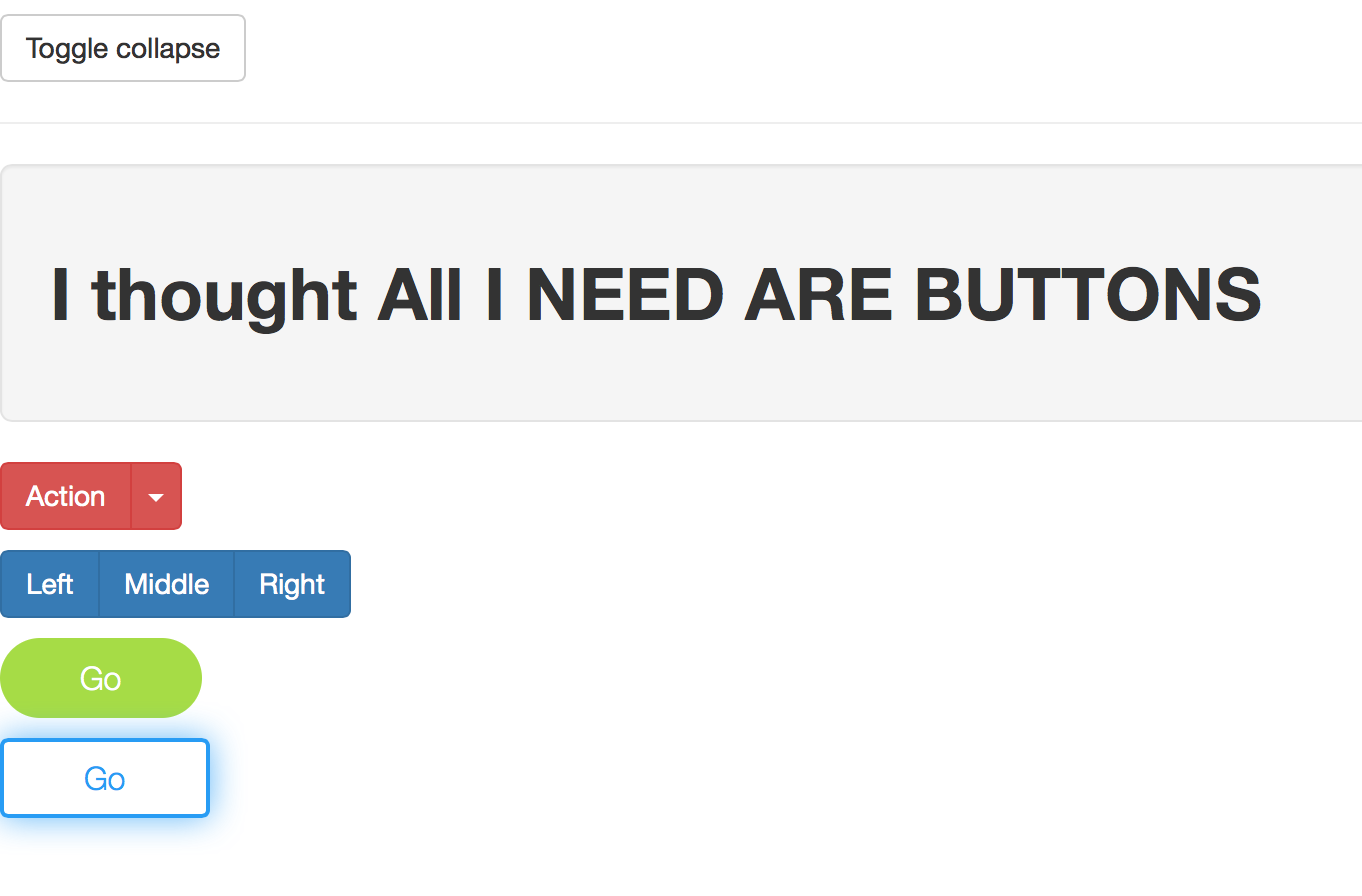
Project 1 / All I need are buttons
For this project, I explored the possibilities of stacking interactive buttons together by piling up the code in html page.
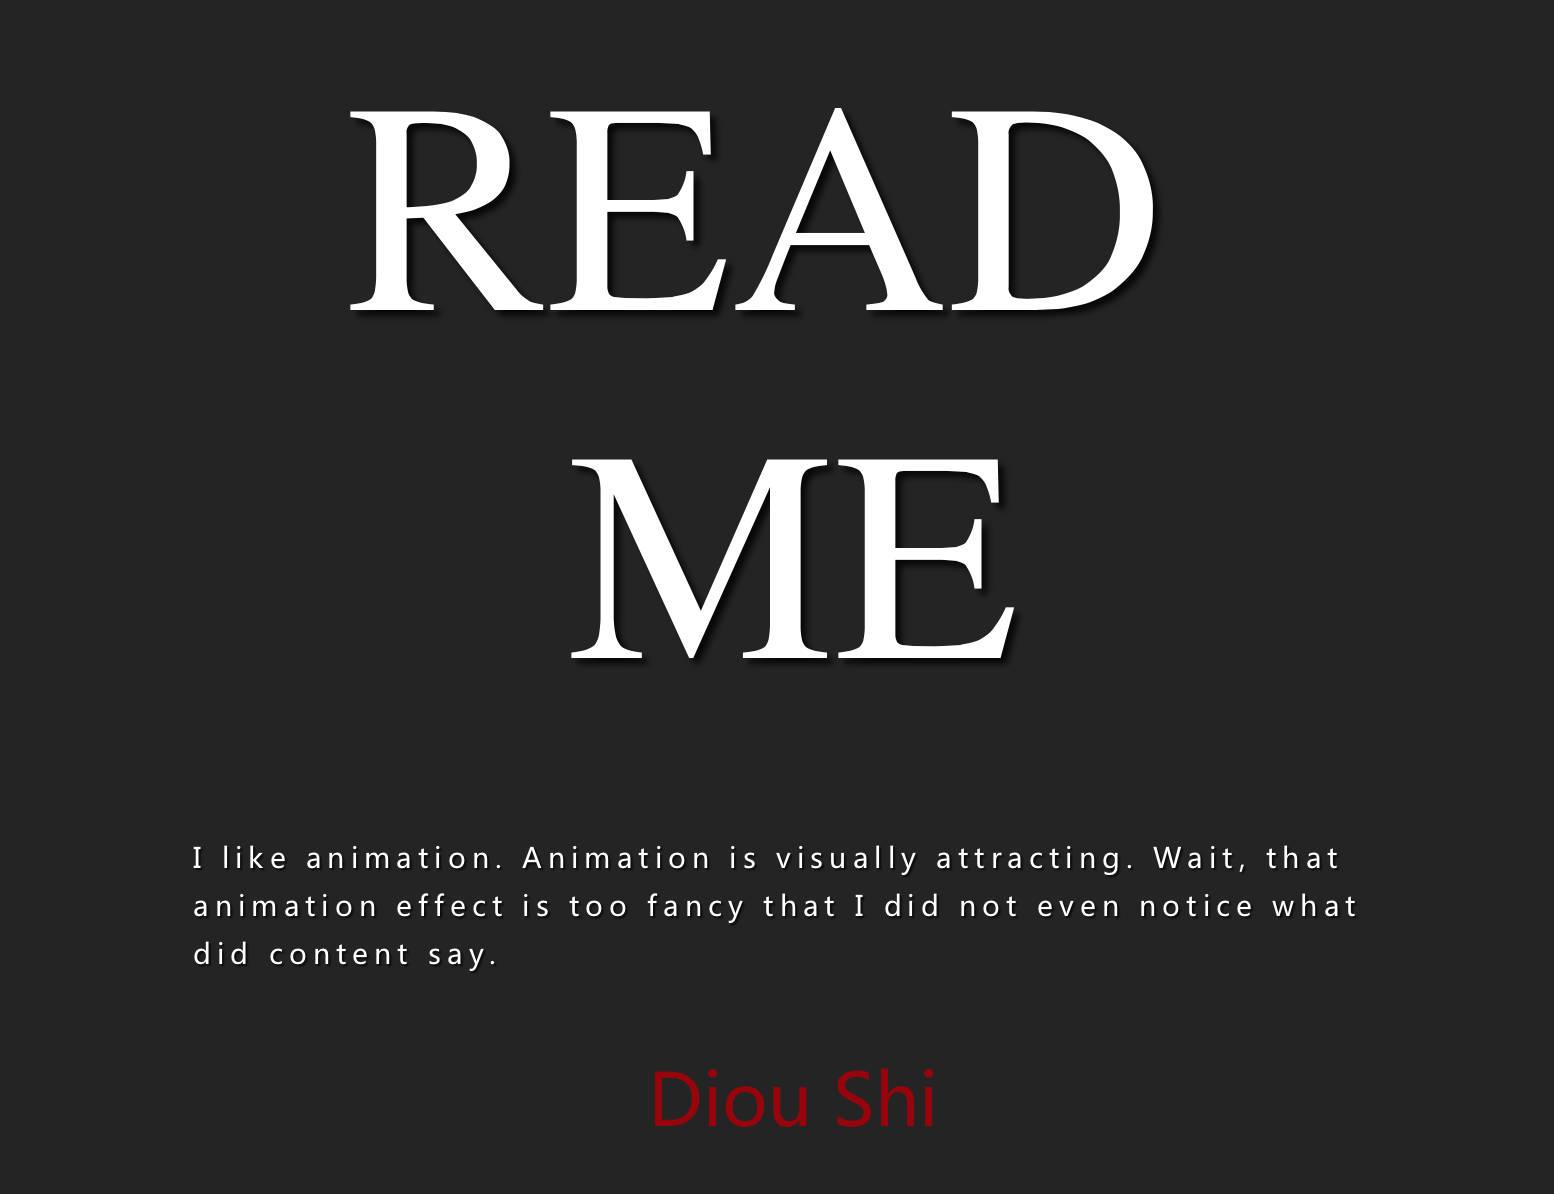
Project 2 / Fancy Distraction
There are lots of distractions. More and more fancy animation effects are available online now. But I wonder if they really serve the purpose of making things better, or just purely distraction?
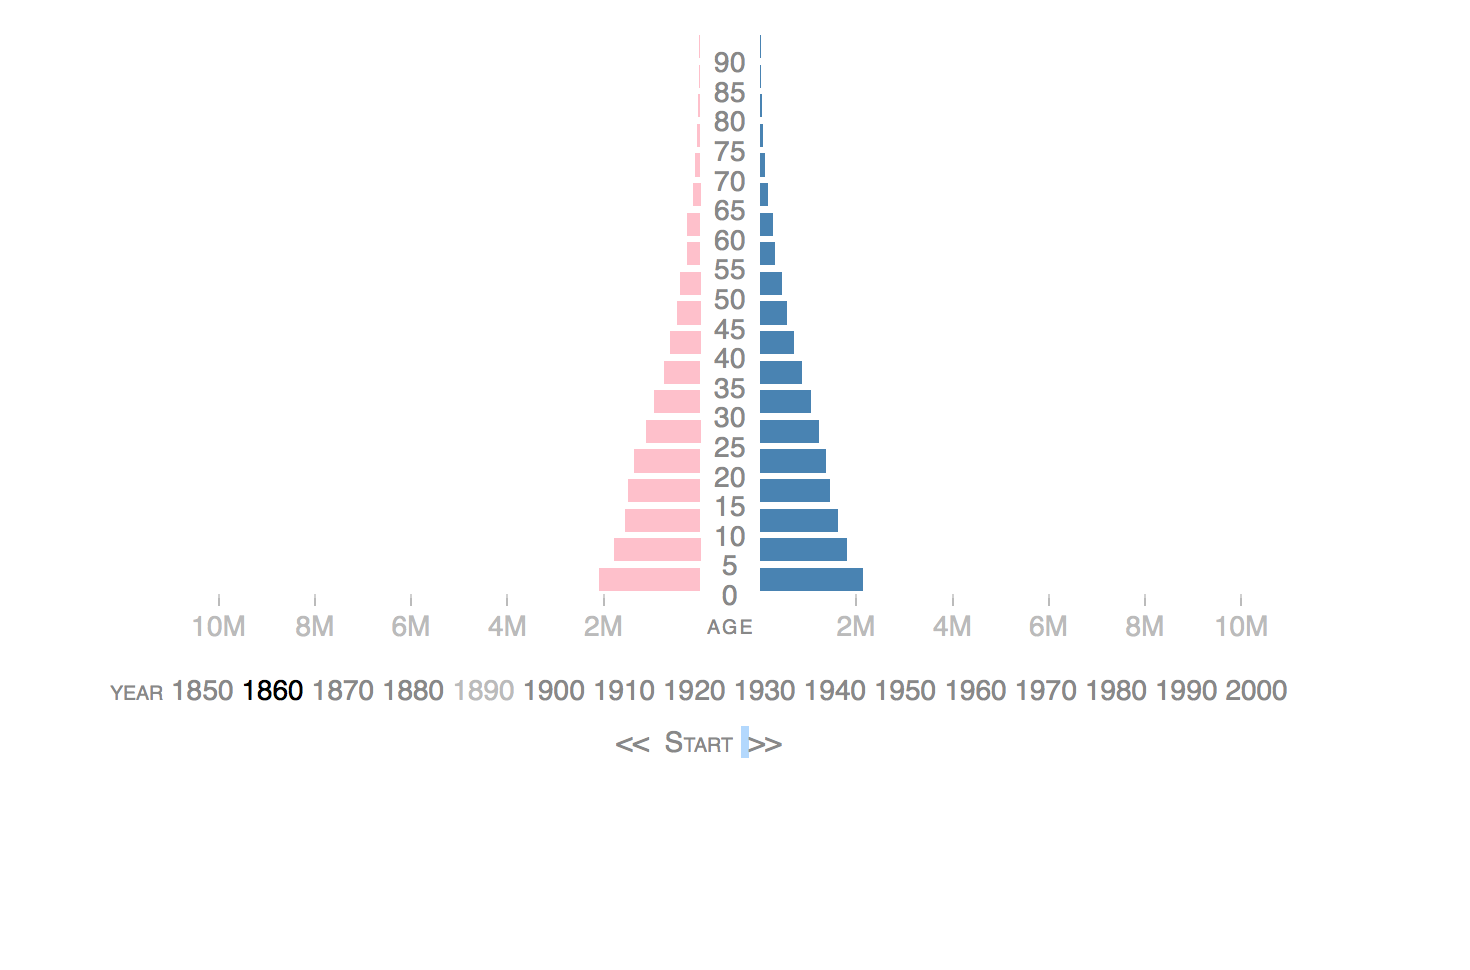
Project 3 / Census Chart.
In this project, I explored the working process with D3.js and how data was presented into a more intuitive way. I used the population data from 19th~20th and divided them by gender and age, then I used an array to list them out and imported into d3. In this way, it is very easy to see when did the population explode and how they look compare to other years.
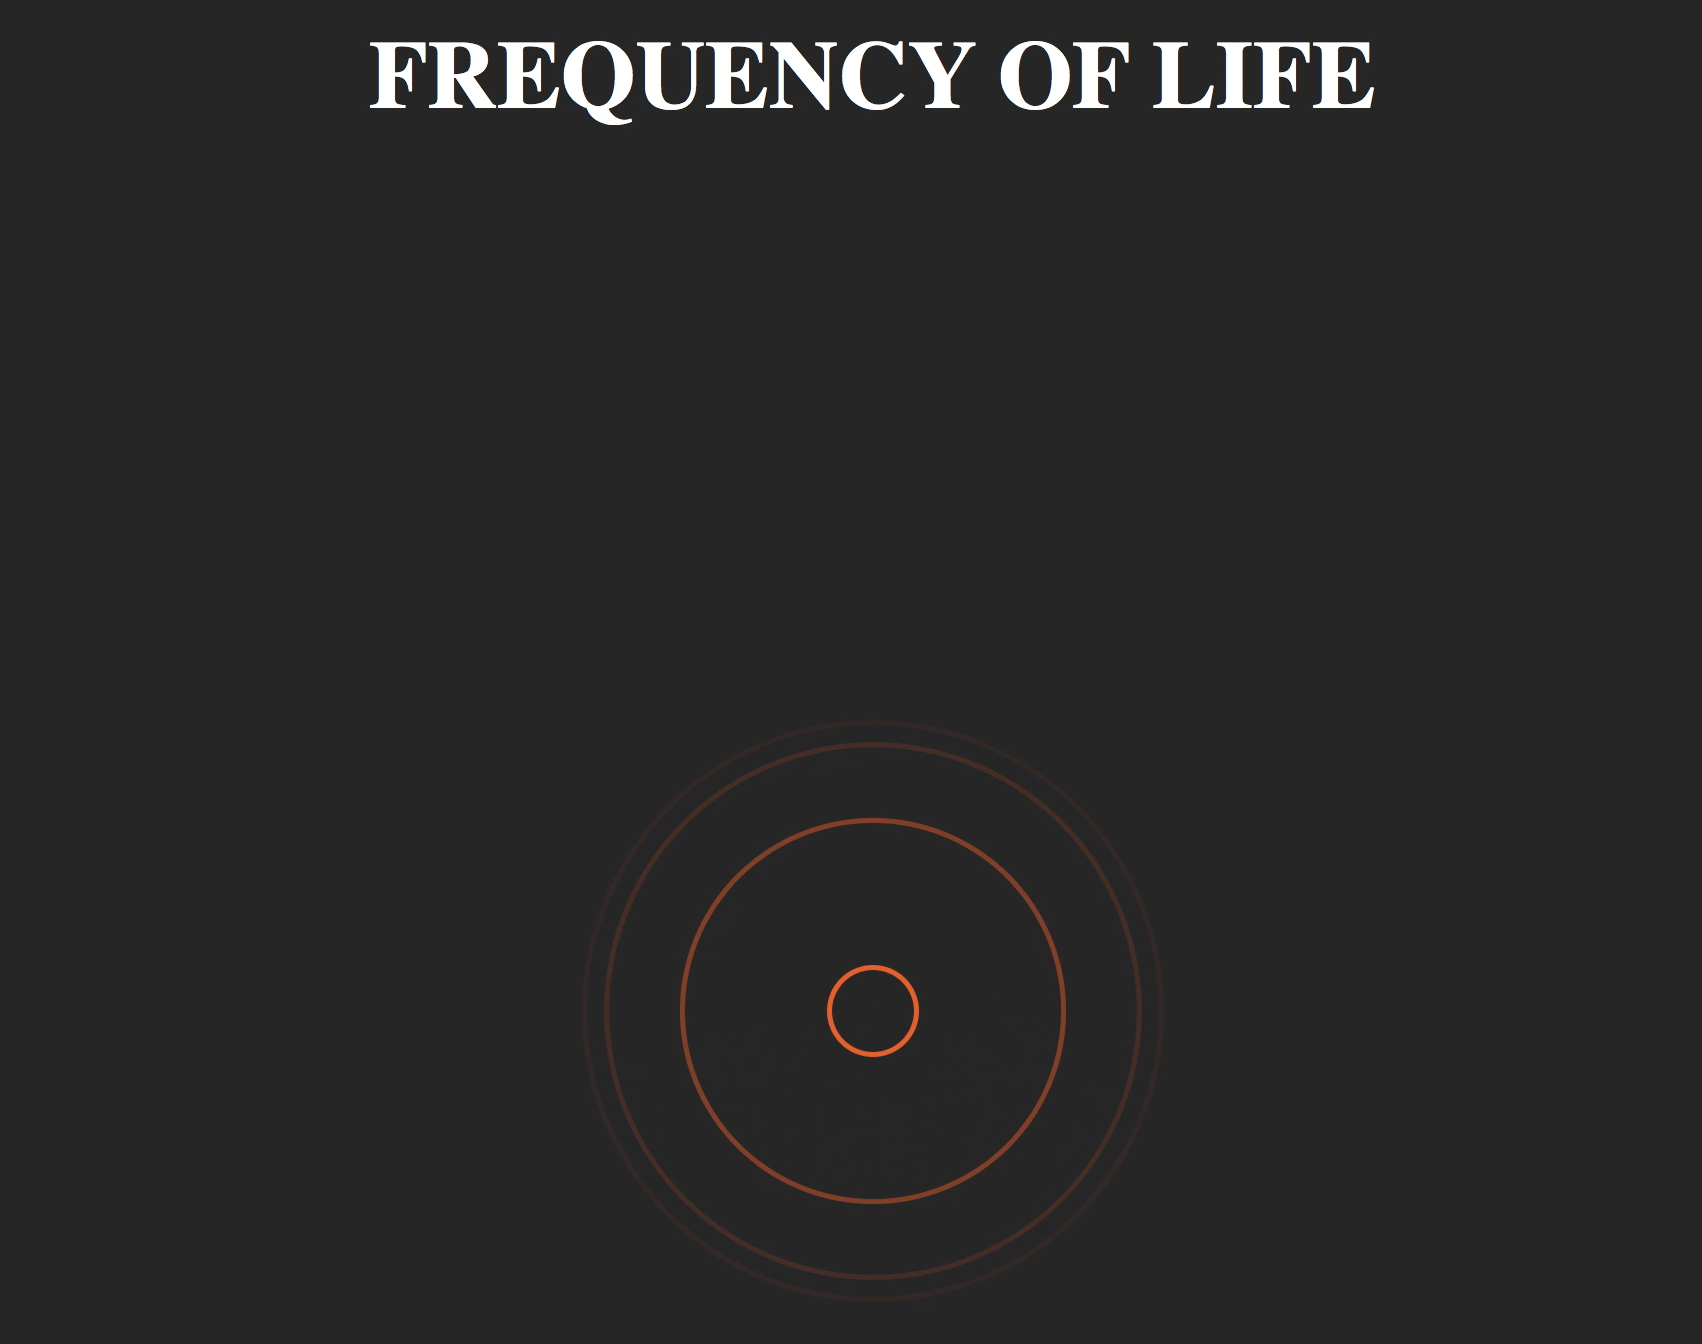
Final Project / Frequency of Twitter Life
This is a project about visualizing the frequency of people tweet using real time engine. It is powered by Socket.IO and Node.js. When tweets pop in from the backend, the graphic in the middle would change and the higher the frequency is, the color would be more colorful. this is a part of thesis that trying to show how unproductive and shallow people are when they waste their life online. But however. this project needs a node server to run so please download it and install node js on your computer and run it. have fun. https://www.dropbox.com/s/j89l3eqggthu3uo/P4.zip?dl=0